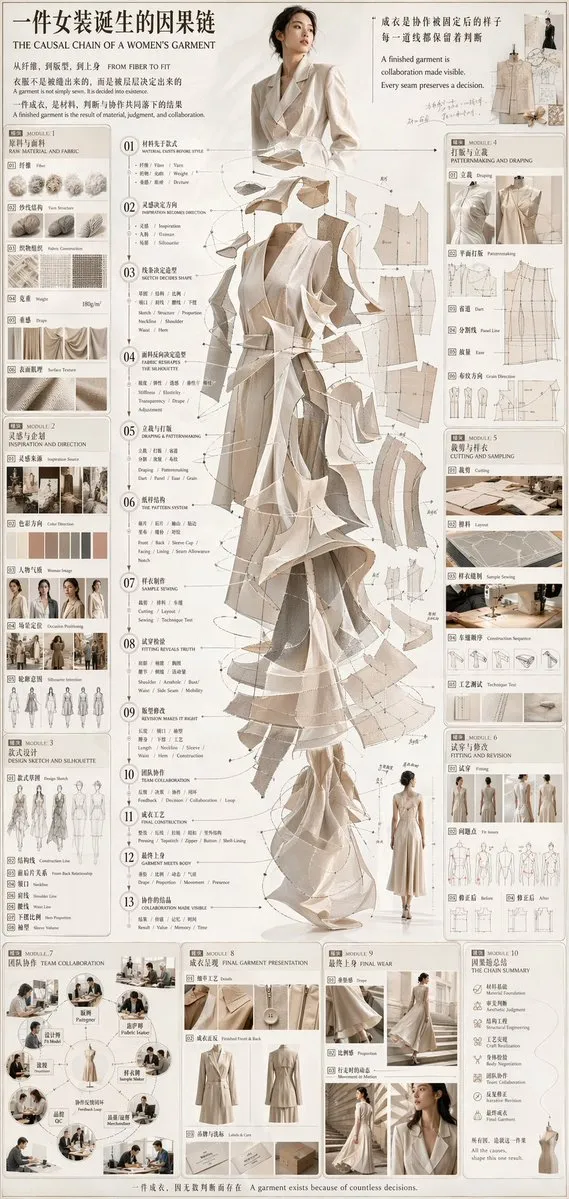
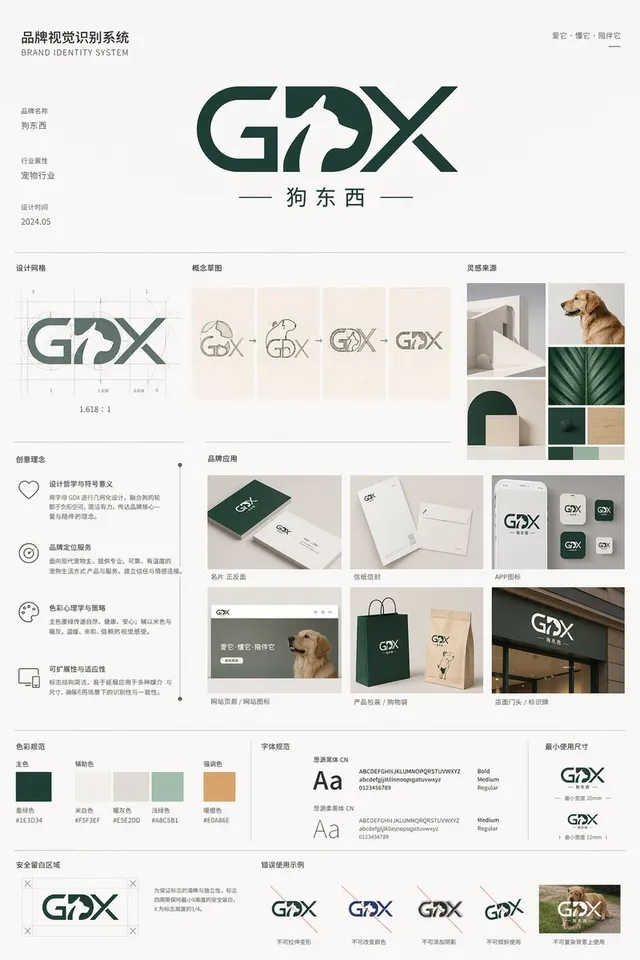
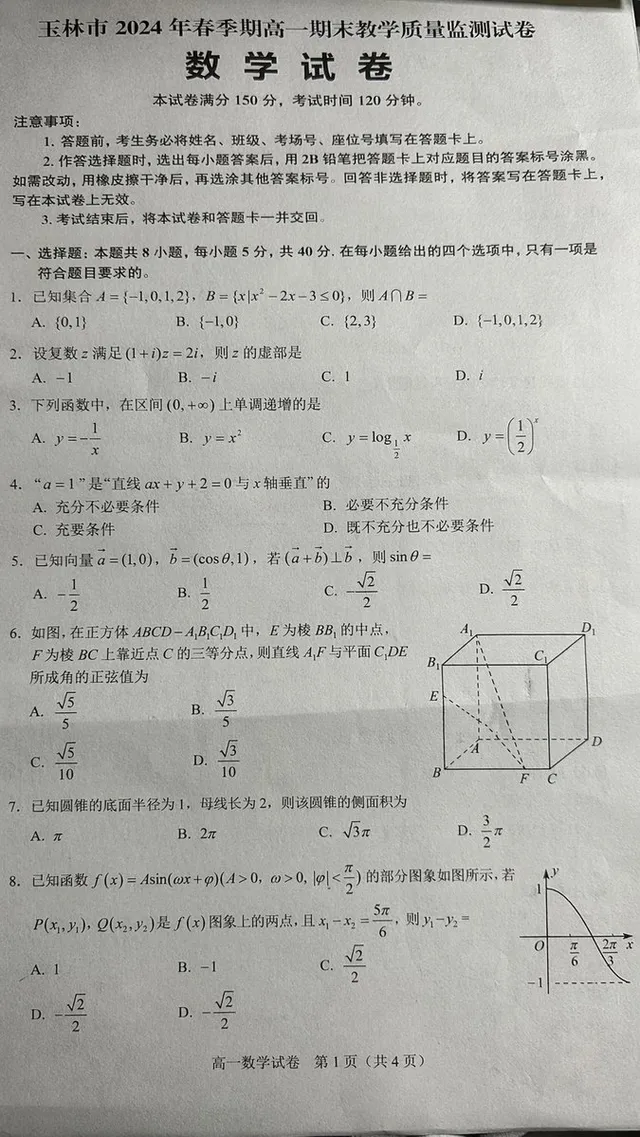
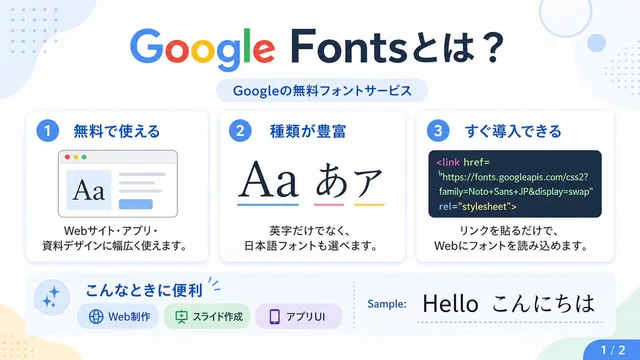
프롬프트/GPT Image 프롬프트/프롬프트 세부 정보이미지 프롬프트4개 패널 DX 보고서 모델 비교참조 이미지에서 일본 DX 보고서 인포그래픽의 4가지 AI 생성 버전을 보여주는 PowerPoint 스타일 비교 슬라이드를 만듭니다.이 프롬프트는 참조 이미지와 함께 사용되었습니다이 프롬프트 사용좋아요104조회9,339북마크68이 프롬프트를 저장하거나 친구와 공유하세요.프롬프트 공유프롬프트복사Using the provided reference image as the source slide, create a 16:9 white comparison canvas showing four different regenerated versions of the same Japanese government-style DX report slide. Layout: Arrange exactly 4 panels in a 2×2 grid with generous white margins. The top-left panel should keep the provided reference slide nearly unchanged and scaled down. The other three panels should be simplified reinterpretations of the same content, each with the same overall logic: red header, red “current issues” block on the left, blue “countermeasures” block on the right, a large blue arrow pointing from left to right, and a green goal band at the bottom. Panel labels: Add exactly 4 small orange model labels over the panels: {argument name="top left model label" default="GPT-Image-2"}, {argument name="top right model label" default="GPT-Image-1.5"}, {argument name="bottom left model label" default="MAI Image 2 Efficient"}, and {argument name="bottom right model label" default="Flux.2 Flex"}. Text and content to preserve from the reference: Keep the main theme as {argument name="main headline" default="DXレポート 2025年の崖"}. Preserve readable Japanese key phrases such as “2025年の崖”, “12兆円損失”, “現状と課題”, “対応策”, “既存システム”, “経営戦略不在”, “DX人材不足”, “DX推進ガイドライン”, “見える化指標”, “共通プラットフォーム”, “モデル契約・アジャイル”, “人材育成”, “刷新ロードマップ”, and the green goal message about “2030年 GDP130兆円”. Panel differences: The top-right version should look like a clean, simplified PowerPoint infographic with a long red title bar, a yellow warning banner near the top, stacked red issue boxes on the left, stacked blue solution boxes on the right, and a large gradient blue arrow in the center. The bottom-left version should look more compact and slightly imperfect, with multiple red issue sections on the left and three blue response sections on the right. The bottom-right version should look like a neat minimal slide with a dark red title bar, a yellow loss badge, two bordered columns, and a green bottom goal bar. Style constraints: Make the overall image look like a screenshot of a PowerPoint slide comparing output quality across image models. Keep all four panels legible, flat, and infographic-like. Do not add photo-realistic elements, people, watermarks, or extra panels.프롬프트 보기